Investment strategy for 2020 amid rising volatility
The upside is there, though it’s now limited
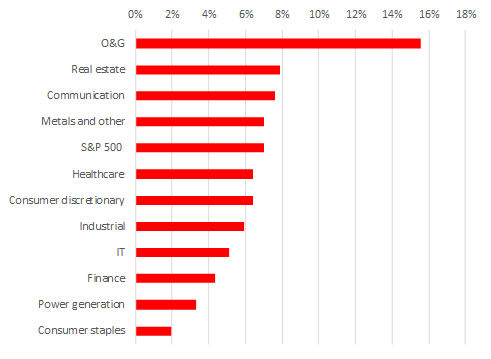
Investment returns topped expectations of most optimistic professional investors this year, as the U.S. IT companies, and Russia’s oil and gas outperformed all other asset classes.
This is an odd combination that reflects growing demand from the world’s largest booming retail sector, an improvement in geopolitics and demand for the most undervalued companies by P/E that account for the largest share of the world’s production in gas and the leading oil producers. Both sectors advanced over 40% in dollar terms. The market is growing strongly, as the U.S. and China are heading towards a phase one deal in early January. The long-awaited agreement provides investors with new risk-on opportunities at the start of the year and is seen as a tactical option to carry investment positions for next year without the need to take profits now, before year end. At the same time, 2020 will see more volatility as compared to 2019, as the U.S. presidential race is set to start in 1H20 amid limited upside across key liquid securities. The environment will depend on the outcome of trading deals, Brexit and other risk factors of the past years. Hedge strategy implies buying call-options as well as ETFs on VIX (UVIX US Equity).
Our investment ideas — overview
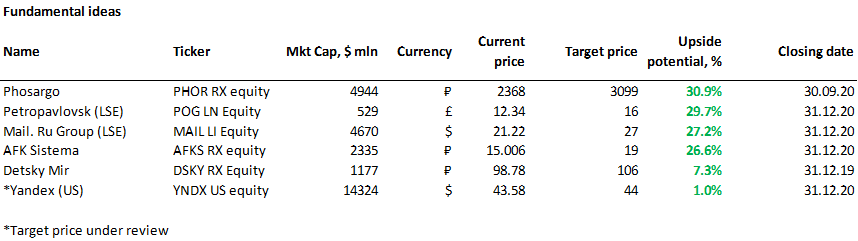
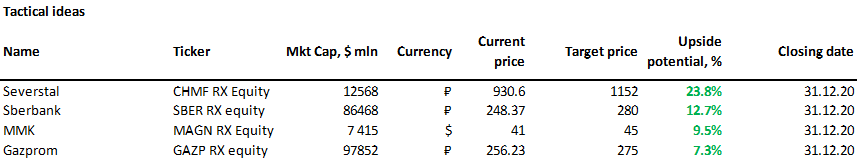
Amongst others good tactical play in the Russian market are metals and mining stocks like MMK and Severstal. Amongst fundamental long-term recommendations we suggest Petropavlovsk, conglomerates like AFK Sistema and Russian IT-stocks, such as Yandex and Mail.ru Group as well as chemical producers, such as Phosagro. Generally, we think that next year we will see good value in the second-tier stocks and some tier 1, as was mentioned earlier. However as country risk premium for Russia will continue falling, Sberbank could see its stock price approaching closer to 300 roubles while Gazprom could test 280 roubles and higher.
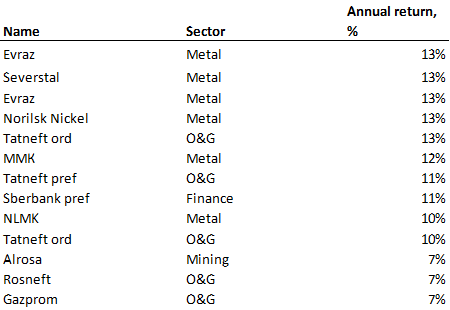
The rouble’s further strengthening and stability is key to Sberbank's growth. Gazprom remains the cheapest stock by the net asset/capitalization ratio. We also believe that the rouble will retain its appeal and will strengthen further. Our RUBUSD end Q12020 target is 60.5. We also recommend the highest yielding dividend stocks in 2020 (annual dividend yield estimate), such as Severstal (13%), MMK (12%), Tatneft pref (11%) and Norilsk Nickel (9%).
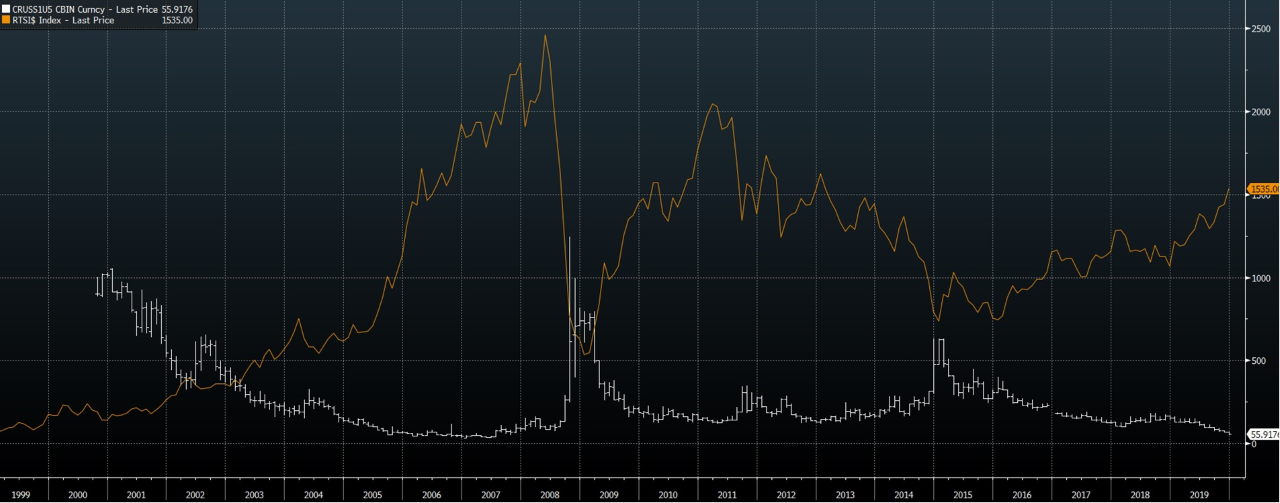
The Russian stock market is still lagging behind the Russian CDS 5Y, bringing the country risk cost down to the level of July 2007 and supporting the Russian market upside. Previously, when CDS 5Y were trading at 57.3 (current level), the RTS Index was as high as 2,000 points. ETF RUSE, the RUSE (Russian Equities) Exchange Fund, which includes shares of the Russian majors (Gazprom, Sberbank, Lukoil, Yandex, RN, Norilsk Nickel and others) is the best asset to buy the index.
In terms of S&P 500, oilfield service companies such as Marathon Petroleum, EQT, Schlumberger, Halliburton and Cabot Oil, as well as individual shares (see the report for details) are still the most undervalued. The US small cap stocks, which suffered the hardest blow from trade wars, remain subdued, therefore it is reasonable to take a look at Russel 2000 index, especially at the transport sector.
Outlook and strategy
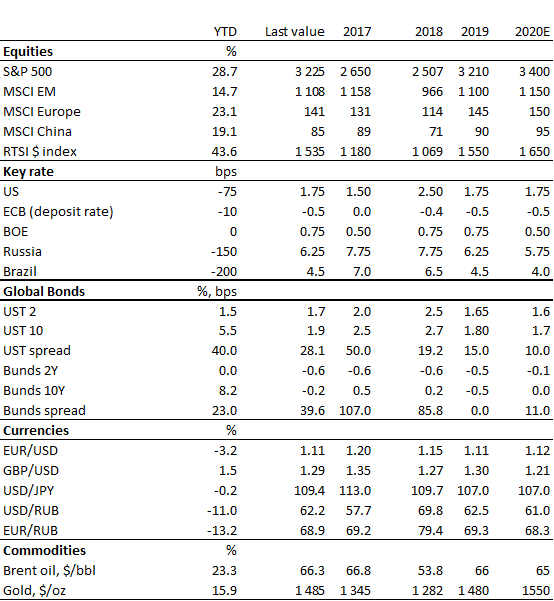
Sources: ITI Capital, Bloomberg
Best and worst performing assets, ytd, $, %
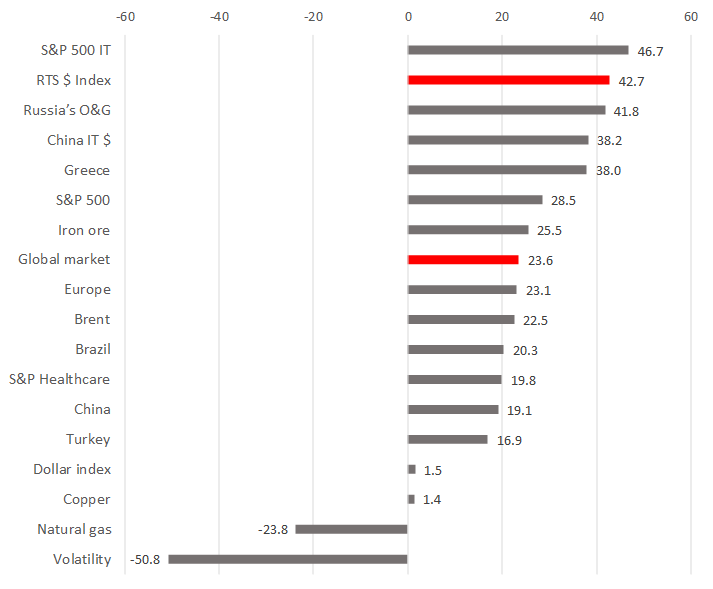
Sources: Bloomberg, ITI Сapital
Another positive and more fundamental factor is a very encouraging set of U.S. economic data for November: industrial production was up over 1% vs seasonal weakness in previous months, housing starts and building permits increased, personal consumption gained 3.2% in Q3 bringing the final GDP Q3 reading to 2.1%. We have seen recovery thereafter and fading risks of recession which are well reflected in the spread between the short and long-term U.S. treasuries which is now negative (-29 bps) after reaching 5 bps at the end of August. Things were looking ugly back then and everyone expected recession to come, hence there are growing debate that the spread will narrow, and long UST could head to 3% next year instead of 2% now.
UST 2Y and 5Y spread, bps
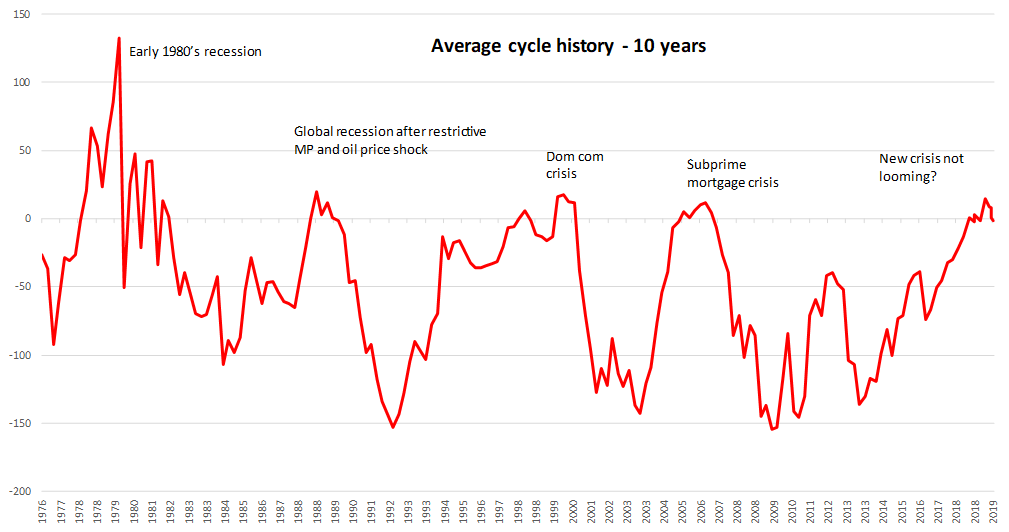
Sources: Bloomberg, ITI Сapital
Why recession is unlikely in 2020?
The effective trade tariffs rate on imports from China next year is likely to fall to 16% compared with earlier plans that would have seen it rise to around 25%, according to Fitch. Therefore, if phase 1 will be succeed, China could see turnaround in its economic growth performance to 6% in 2020 instead of 5,7% as was expected earlier. Generally according to IMF, global economy could grow by over 3% instead of slowing down that we saw last year as chances of phase 1 trade agreement are increasing. Much of the rebound in global economic growth is seen due to pick up in GDP of EM economies by 4,7% next year thanks to increasing share of service sector as opposed to manufacturing which for most economies is below 50, suggesting slowdown in growth.
Low interest rate environment will push demand for equities. Lower interest rates and low inflation would continue to force investors to seek out yield. According to October 2019 Global Financial Stability Report, more than 30% of the debt in advanced economies has a negative interest rate, while half is between 1% and 2%. Over the long term, an earnings yield (which is the inverse of the price-to-earnings [P/E] ratio) of 5.3% would be even more attractive. Global GDP will grow 3.4% in 2020 up from projected 3% in 2019, driven largely by emerging markets that account for 46% of the global economy now and their share is rising.
Looking ahead, even if the global economy is on the mend, the likelihood of the Fed keeping rates steady next year is tethering the yields on short-dated treasuries. And those at the long end are capped so long as investors are searching the globe for positive-yielding assets willing to pounce on any cheapening in U.S. government debt.
Global markets are well supported by excess liquidity inflow
Dovish monetary policy stance and government fiscal measures will remain intact next year as well. For example, the US continues QE policy after purchasing over $130 bln in bonds and conducting overnight and term repo operations to help rebuild banking reserves, adding $237 bln of liquidity. It’s also prepared to inject up to $490 bln around December 31. The Fed’s total asset value is now over $3.7 trln. Value of the U.S. money market is now over $3.6 trln, this is the cash pile that could be partly diverted to the US equity market as yields and rates are low while earnings yield on US equity is near 5%.
On the US equity market, buy-back volume has been above $770 bln ytd, dividend payments are over $500 bln and M&A deals completed mounted to $1 trln and over $1.3 trln is still pending.
Source of liquidity on U.S. equity market, $ bln
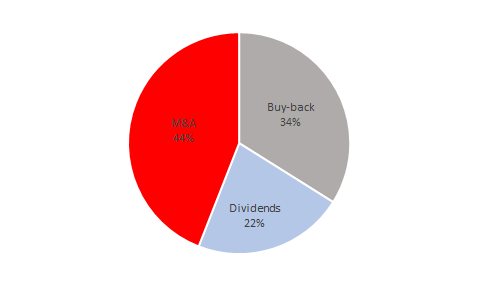
Sources: Bloomberg, ITI Сapital
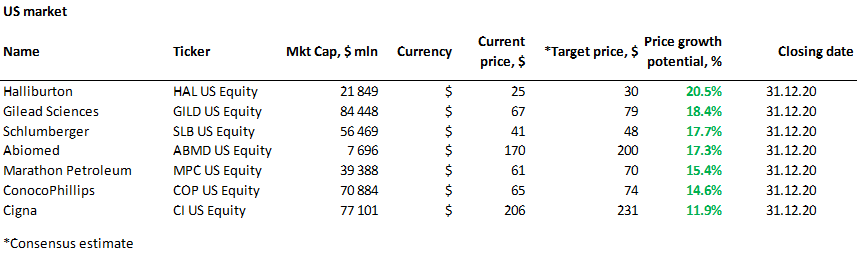
What to BUY on US equity market?
The most undervalued amongst S&P 500 sectors remain oil service stocks and producers such as Marathon Petroleum, EQT, Schlumberger, Halliburton and Cabot Oil and individual stocks such as Abiomed, Gilead Sciences, US Cellular Group, Textron, Amazon, Constellation Brands and TripAdvisor with decent double-digit upside for next year. Most oil and gas companies in the US, such as Halliburton and Schlumberger, have been trading at local lows seen in 2002, but they advanced 30% since October amid upward trend and have double-digit growth potential due to business optimization, debt reduction, a new buy-back programme and improved production efficiency. This is especially the case with the U.S. oil and gas sector, which are heavily leveraged following 2014 production boom, when drilling rigs count hit all-time high. It is also reasonable to take a look at biopharmaceuticals, for example, Gilead Sciences (GILD US Equity) with a 18% upside in the next 12 months in dollar terms — the company has recently benefited from news about innovations,, new deals and easing concerns about political risks.
Most undervalued US sectors in the next 12 months, %
Sources: Bloomberg, ITI Capital
Sources: Bloomberg, ITI Capital
Stronger volatility — top picks
- Trading in call options on the Cboe Volatility Index, known as the VIX, outweighed puts by more than 2-to-1 with the index at its lowest level since July as stocks rallied
- The standout trade was one block of 50,000 April $65 calls that were bought for 10 cents. Those contracts would imply a surge in the VIX of almost 500% from its current level. April calls imply geopolitical risks growth
- Therefore, in terms of hedging, we recommend ultra-cheap call options on volatility purchase, or putting it simply exposure to ETF on VIX (UVXY US Equity), the asset is trading at local lows, only 4 p.p. from the historic lows and has strong upside
The biggest surprise of the year or market of the year is Russia
- Russia is seen as the biggest surprise rising by over 40% (RTSI$) in USD terms and 27% in rouble terms (MOEX) after years of prolonged sanctions starting in 2014 and re-emerging in 2018 following Rusal and Skripal case
- The market has focused on supreme fundamentals which still make this market hugely attractive as carry trade returns are among the highest in the world as inflation and GDP is falling to zero over the next few years while nominal rate is still above 6%
- We estimate upside for the Russian market next year from 10 to 15% after RTSI rallied over 40% this year tracing the performance of U.S. top IT-stocks
Why foreigners in love with Russia?
- The reserves are well above $545 bln and external debt continues to decline pushing debt-to-GDP ratio below 5% for all sovereign issues and just below 30% for all debt both in USD and in roubles . Stocks remain cheap trading with 40% discount to EM peers and with over 60% to DM peers and dividends could be close to 8+% this year, while the rouble has been the most resilient currency in EM and one of the least volatile in the world as inflow into local sovereign bonds amounted exceeded $17 bln after outflows reached $7 bln last year. So, non-residents were both supportive of equity (3/4 of all equity free float are owned by international investors, or 25%) and FX-market (32% of OFZs owned by non-residents)
- We see still see a decent upside in Gazprom next year which gained 67% this year already despite sanctions against Nord Stream-2, as the stock is trading at P/B at 0.4
- Sberbank which is up by 31% this year is a perfect proxy for the strong rouble play and is closely correlated with the FX and OFZ, since 46% of the customers hold deposits in Sberbank, while only 20% of these are FX-deposits. Every time after the U-turn, when RUBUSD is expected to strengthen, it's reasonable to increase exposure to Sberbank. But this must be accompanied by oil prices growth, as it’s the case now. Now, with the oil trading at $66/bbl, RUBUSD looks justified, although the correlation between the Russian currency and oil has dropped to 37%
- Amongst others good tactical play are metals and mining stocks like MMK and Severstal
- Amongst fundamental long-term recommendations we have Petropavlovsk, conglomerates like AFK Sistema and Russian IT-stocks, such as Yandex and Mail.ru Group as well as chemical producers, such as Phosagro. Generally, we think that next year we will see good value in the second-tier stocks and some tier 1, as was mentioned earlier
Sources: ITI Capital, Bloomberg
2019 dividend ideas rolling over to 2020
Sources: ITI Capital, Bloomberg
The rouble outlook
- The rouble will remain an attractive investment target next year unless the sanctions rhetoric changes. The sanctions premium has dropped by 11% and stands at 10% now
- We estimate the fair RUBUSD rate excluding the sanctions premium at 56 RUB
- At the beginning of the first quarter (traditionally positive for the rouble) of 2020, we expect RUBUSD to strengthen to 60.5 RUB, by mid-1H20 it may move just below 60 RUB, to 58 RUB, if relations between Russia and Ukraine improve further, the U.S. administration creates no additional geopolitical risks and the U.S. and China resolve trade issues
China and Asia could be the best performers next year
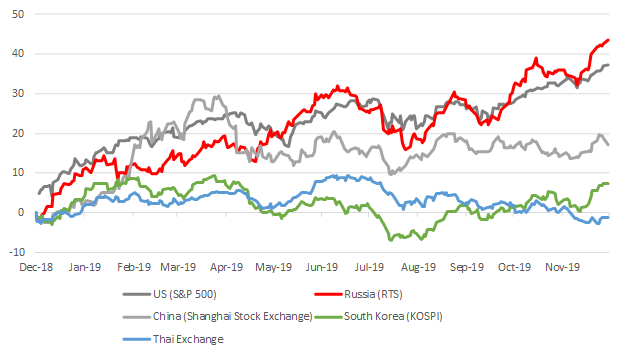
- If phase 1 trade agreement will be completed leading to the second phase, China and South Asian countries could strongly outperform DM and EM peers due to lagging performance this year
- For example, Thailand, Malaysia and Indonesia are down this year while Thailand’s upside for the next year is double digit. India and South Korea are up by over 8% while upside is close to 15%. Generally South Asia and Pacific markets are up by 16% but have another 10+% upside according to consensus, while China is up by 19% but upside consensus is over 14% in USD terms
Best and worst (lagging) performing indices ytd, $, %
Sources: ITI Capital, Bloomberg
RTSI $ index vs Russian CDS 5Y
Source: Bloomberg, ITI Сapital
The Research is issued for the information of professional investors and institutions only. The Research is not intended to provide the basis for any evaluation of an investment decision. Your attention is drawn to the date of issue of the Research and of the opinions expressed therein. Any opinions are subject to change without notice. The Research is based on information obtained from sources believed to be reliable, which has not been independently verified and are not guaranteed as being accurate, complete or up-to-date. The Research is not and should not be construed as or forming a part of any offer for sale or subscription of, or any invitation to offer to buy or subscribe for, any investments, nor should it or any part of it form the basis of, or be relied upon in any connection with any contract or commitment whatsoever.
The Research is made available without responsibility on the part of ITI Capital Limited who neither assumes nor accepts any responsibility or liability (including for negligence) in relation thereto. No action should be taken or omitted to be taken in reliance upon information, data or materials in the Research. Advice from a suitably qualified professional should always be sought in relation to any particular matter or circumstances. Nothing in this Disclaimer excludes or restricts any duty or liability to a customer which ITI Capital Limited has under the Financial Services & Markets Act 2000, under the Rules of the FCA, or to the extent liability cannot be excluded or restricted under applicable law, rule or regulation.
ITI Capital Limited is, unless otherwise stated, the owner of copyright over the Research. Except for personal use only (including saving to an individual storage medium and printing such extracts from the Research as are necessary for such use) or as permitted by the Copyright Designs and Patents Act 1988, no part of the Research may be published, distributed, extracted, reutilised, or reproduced in any material form (including photocopying or storing it in any medium by electronic means and whether or not transiently or incidentally to some other use of this publication). ITI Capital Limited reserves the right at any time at its discretion to withdraw or modify the licenses set out above. The above permissions do not apply to any content supplied by third parties. For permitted use of third party content apply to the relevant content owner. The securities and other financial instruments (and any related investments) and investment services described in the Research may not be suitable for all people. Before entering into an agreement in respect of any such investments, you should consult your own investment advisers as to their suitability for you and should understand that statements regarding future prospects may not be realised.