Time to buy US volatility (US VIX)
Рынок Акций
Рынок Облигаций и Валюта
We think the US market looks overheated and recommend to take gradual long positions in US VIX via ETF such as UVXY.
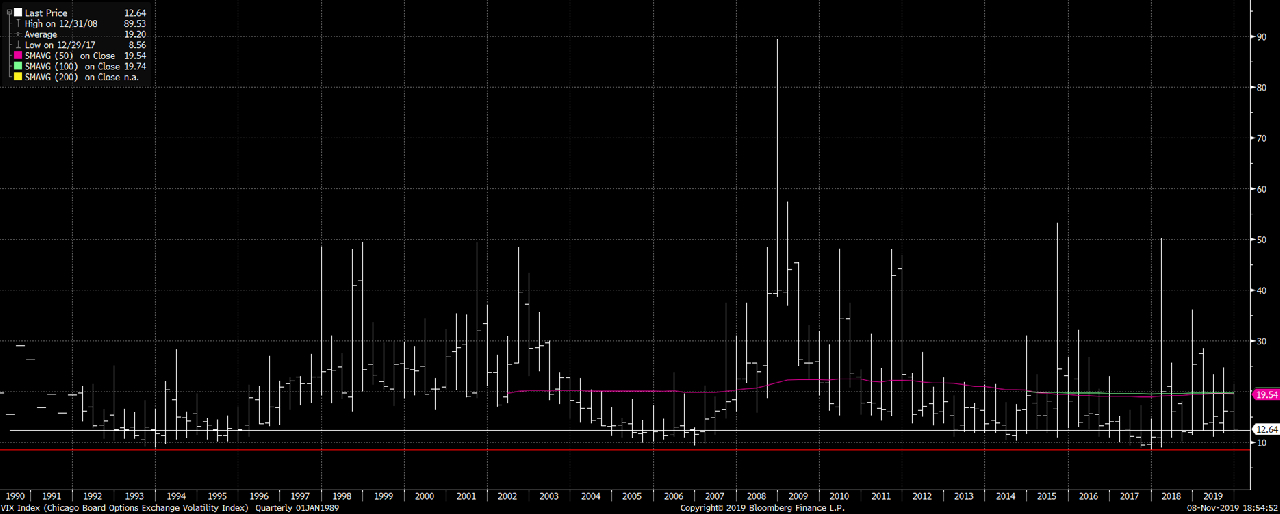
US VIX is currently trading just 2.4 p.p above minimum level over last five years and 40 p.p below 5-year maximum. Hence potential for rebound is huge given higher risks of volatility next year.
Performance and trend
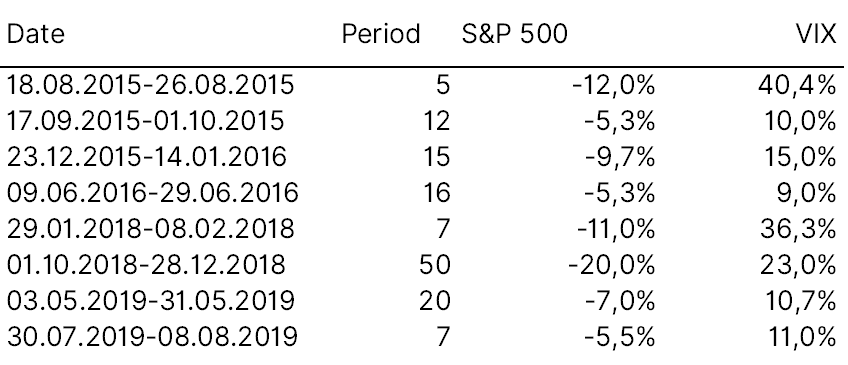
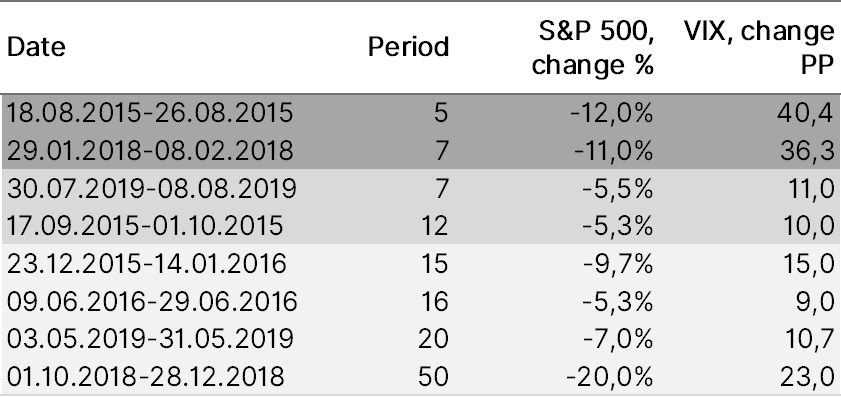
- US VIX, a bet on the volatility index by opening short positions in S&P 500 (-55%), has been the worst-performing asset year-to-date, while the S&P 500 surged 24%
- US VIX now stands at 12.6%, 2,4 pp (16%) below the five-year average of 15%. The five-year low was just under 9% (24 November 2017), 7 pp (28%) below the five-year average
- The index’ highest exceeded 53% (August 24, 2015) after a continued market growth, thus deviating more than 4 times from the current reading
Source: Bloomberg, ITI Capital
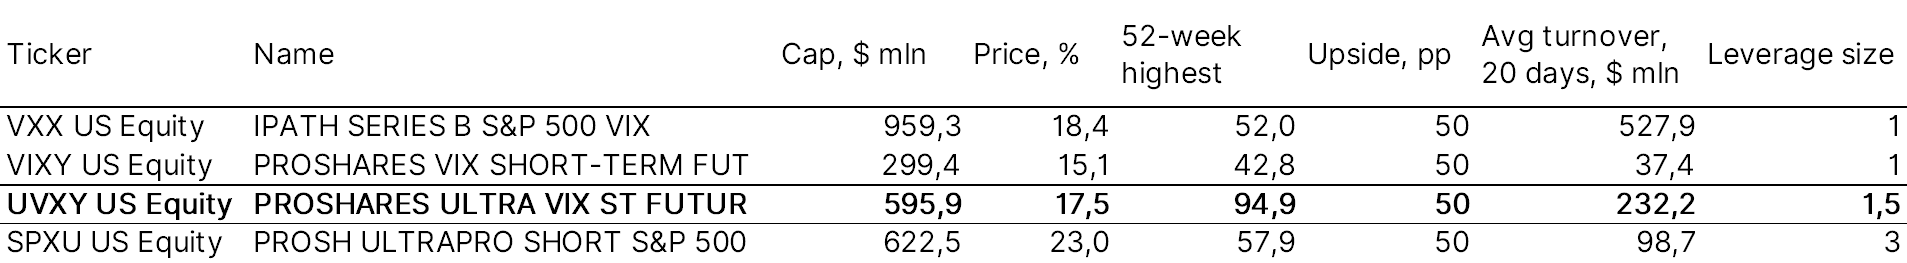
What to buy?
Like all indices, one cannot buy the VIX directly. However, investors can take positions in VIX through futures or options contracts, or through VIX-based exchange-traded products (ETP).
The difference between exchange-traded products is in the leverage size
Source: Bloomberg, ITI Capital
Key features and potential return
- The volatility depth depends on two factors: 1) duration of market growth before correction 2) speed and depth of correction
- To illustrate, in August 2015 S&P 500 recorded the worst decline in four years, since late 2011, slumping more than 12%; in October 2014, the index posted a more moderate decline. Therefore, since there have not been market declines for quite a while, volatility surged three times in a very short period of time (two weeks), exceeding 50%
- Another good example is a volatility jump from January to February 2018. – the VIX grew by 36 p.p., while the market fell 11% over several weeks
- Therefore, if we see a deeper correction, when the market will fall by 2-3% per day for a short period of time, volatility will skyrocket. In any case, since the chances of a correction in 2020 are much higher, with more room for continued volatility growth, it is a good hedge against the risks and weaker local currency
- S&P 500 most recent material decline was in late 2018, when the index lost 15% in October – December. Volatility was up 23 p.p. amid this correction
- The key year-end trigger of the volatility is that trade negotiations will end up in partial agreement or temporary agreement that could lead to risks of more tariffs, i.e. cancellation of December tariffs but keeping the previous imposed in September or partial cancellation of December tariffs. So far, the risks of such a scenario are low, but in January 2020 everything will change, especially if the market continues to grow by the end of 2019 contrary to historical performance, given that the market has already advanced 4% since the beginning of Q4 against a full-quarter 30-year average of 4.2%. Data for the past 30 years suggests that the first quarter is one of the weakest in terms of market growth (except for 1Q19) that does not exceed 2% on average, with the third quarter being the worst
Source: Bloomberg, ITI Capital
Why buy volatility?
- We live in exciting times when the number of surprise events, the so-called Black Swans, has reached the highest since 2018 (trade wars between the U.S. and its key partners, the global recession, sanctions against Rusal, Turkey), while at the same time the volatility according to VIX is below the five-year average! These factors indicate that the volatility is yet to be priced in after an unprecedented growth of risk assets amid geopolitical instability
- Next year, we will face the same trade wars, as the phase-one trade agreements will be temporary leaving more room for new trade wars
Other risks:
- Donald Trump impeachment
- U.S. Presidential race and elections
- Weakening effect of monetary easing, as the market approached the bottom with no room for further growth
- Recession, as the global economy is in the late growth cycle
What is VIX?
- VIX, is a real-time market index that represents the market's expectation of 30-day forward-looking volatility. Derived from the price inputs of the S&P 500 index options, it provides a measure of market risk and investors' sentiments. Most investors familiar with the VIX commonly refer to it as the “fear gauge,” because it has become a proxy for market volatility
How its calculated?
- VIX index values are calculated using the CBOE-traded standard SPX options (that expire on the third Friday of each month) and using the weekly SPX options (that expire on all other Fridays). Only those SPX options are considered whose expiry period lies within 23 days and 37 days
- While the formula is mathematically complex, theoretically it works as follows. It estimates the expected volatility of the S&P 500 index by aggregating the weighted prices of multiple SPX puts and calls over a wide range of strike prices. All such qualifying options should have valid non-zero bid and ask prices that represent the market perception of which options' strike prices will be hit by the underlying during the remaining time to expiry
Where it’s traded?
- The VIX was created by the Chicago Board Options Exchange (CBOE), which bills itself as “the largest U.S. options exchange and creator of listed options.” The CBOE runs a for-profit business selling (among other things) investments to sophisticated investors. These include hedge funds, professional money managers and individuals that make investments seeking to profit from market volatility. To facilitate and encourage these investments, the CBOE developed the VIX, which tracks market volatility on a real-time basis
How to Trade the VIX?
- Active traders, large institutional investors and hedge fund managers use the VIX-linked securities for portfolio diversification, as historical data demonstrates a strong negative correlation of volatility to the stock market returns – that is, when stock returns go down, volatility rises and vice versa
- Other than the standard VIX index, CBOE also offers several other variants for measuring broad market volatility. Other similar indexes include the Cboe ShortTerm Volatility Index (VXSTSM) - which reflects 9-day expected volatility of the S&P 500 Index, the Cboe S&P 500 3-Month Volatility Index (VXVSM) and the Cboe S&P 500 6-Month Volatility Index (VXMTSM). Products based on other market indexes include the Nasdaq-100 Volatility Index (VXNSM), Cboe DJIA Volatility Index (VXDSM) and the Cboe Russell 2000 Volatility Index (RVXSM). Options and futures based on RVXSM are available for trading on CBOE and CFE platforms, respectively
- Like all indexes, one cannot buy the VIX directly. Instead investors can take position in VIX through futures or options contracts, or through VIX-based exchange-traded products (ETP). For example, ProShares VIX Short-Term Futures ETF (VIXY), iPath Series B S&P 500 VIX Short Term Futures ETN (VXXB) and VelocityShares Daily Long VIX Short-Term ETN (VIIX) are many such offerings which track certain VIX-variant index and take positions in linked futures contracts
VIX Performance for 30 yrs, %
Biggest S&P 500 index declines

VIX and SPX base asset
