ITI Capital: The rouble dynamic and forecast for the rest of the year against USD
The top gainer in a constrained environment
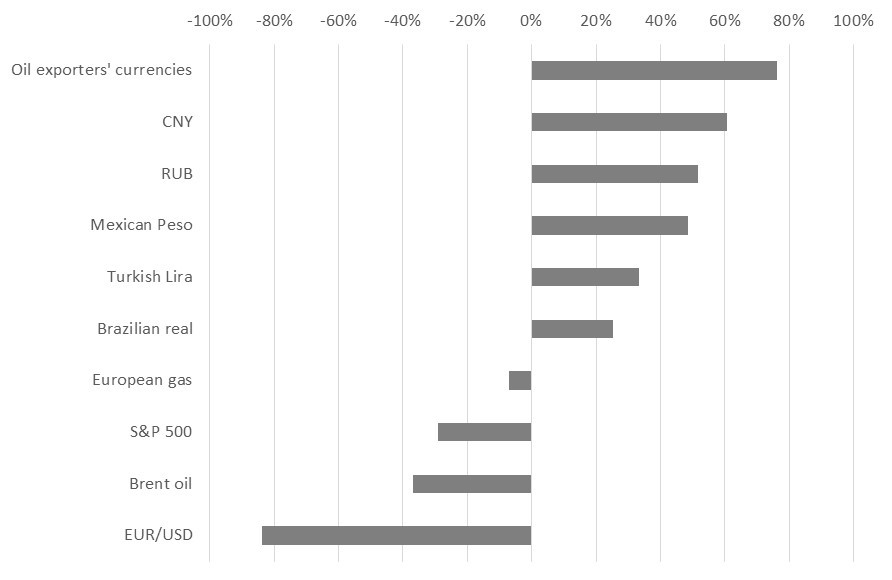
- The rouble (+3.8%) outperformed its key peers against the dollar since the start of the year. Much of the growth came from a lower geopolitical risk premium and strong rally in O&G.
- As seen in the 30-day chart, the correlation between the rouble and oil started to recover on June 16, after the official meeting between Joe Biden and Vladimir Putin in Geneva.
- However, since late August, with the surge of the oil and gas prices, the oil-rouble correlation has started to decline, and the 30-day curve has dropped to 20% at $73/bbl and now stands at 34% at $82/bbl.
- One of the key global reasons behind this trend is a stronger dollar, the DXY index having advanced by over 5% against the key currencies since the start of the year, but most of the growth increase came precisely at the end of August and the beginning of September, following a 35-bps jump in US treasuries’ yields.
- Our official forecast for the USDRUB is ₽71 for late October, ₽70.5 for November and ₽69-70 for December.
Global currencies against the dollar, ytd, %
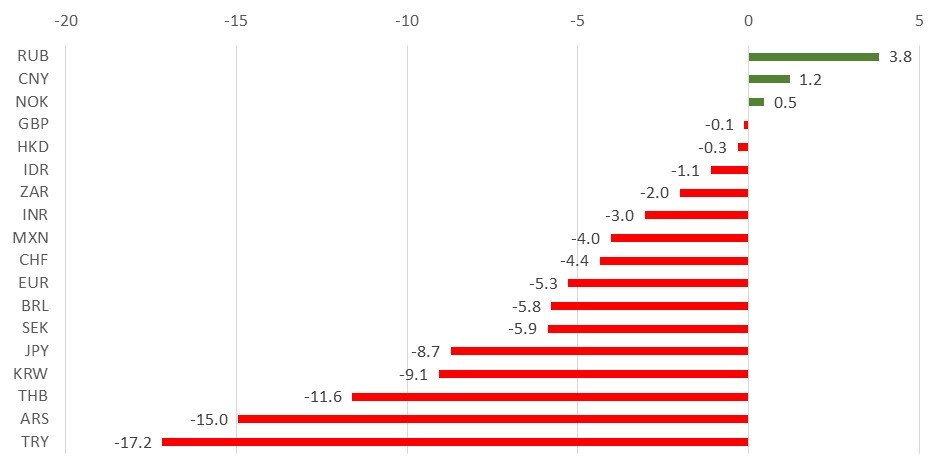
Source: Bloomberg, ITI Capital
Correlation of the RUBUSD and oil
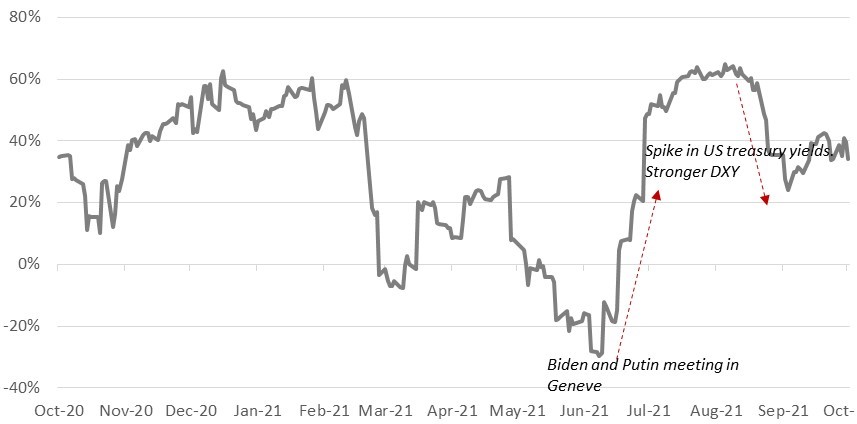
Source: Bloomberg, ITI Capital
Key local factors for low correlation of the rouble and oil
1) FX-purchases by an average of $200 mln a day over the last two months as part of budget rule, which accounts for up to 7% of daily USD/RUB trading including MICEX TOM+TOD
2) A drop in FX-sales by exporters for tax and dividend payments to an average of 20-25% of total FX-sales
3) Relatively high gradient in export revenue sterilisation due to lower oil production and exports (although under OPEC+ agreement, production is currently down by only 0.6 mbpd, or 6% below the level before the OPEC deal)
4) Lower non-residents funds inflows since September on the back of rising inflation expectations and a continuation of the key rate hike cycle
Fair USDRUB rate at the current oil price
If we exclude all of the above or at least assume positive developments towards lower export revenue sterilisation, increased FX-sales, higher non-resident fund inflows, etc., then the USDRUB should not be significantly exceed ₽60 given the current Brent oil price.
Positive short-term factors for the rouble
- The key factor for the next two and a half weeks is FX-sales for the interim dividend payments for the first half of 2021. Given payments from key exporters, particularly Rosneft, Novatek, MMK, Alrosa and other companies, the total payments will amount to a record ₽466 bln, or $6.4 bln, of which $1.6 bln will be used for FX-sales, accounting for 6% of total MICEX trading volume for the two week to 25 October.
- Therefore, the effect will be positive, and it has already started to materialize since the end of last week. Rosneft, for example, will pay a record ₽18.03 per share for 2019 against ₽18.07 per share for the first half of 2019.
- Tax payments, one of the biggest of the year, are also scheduled to start in mid-October. MET, VAT and excise duty payments will start on October 25.
Dividend payments schedule for October 2021
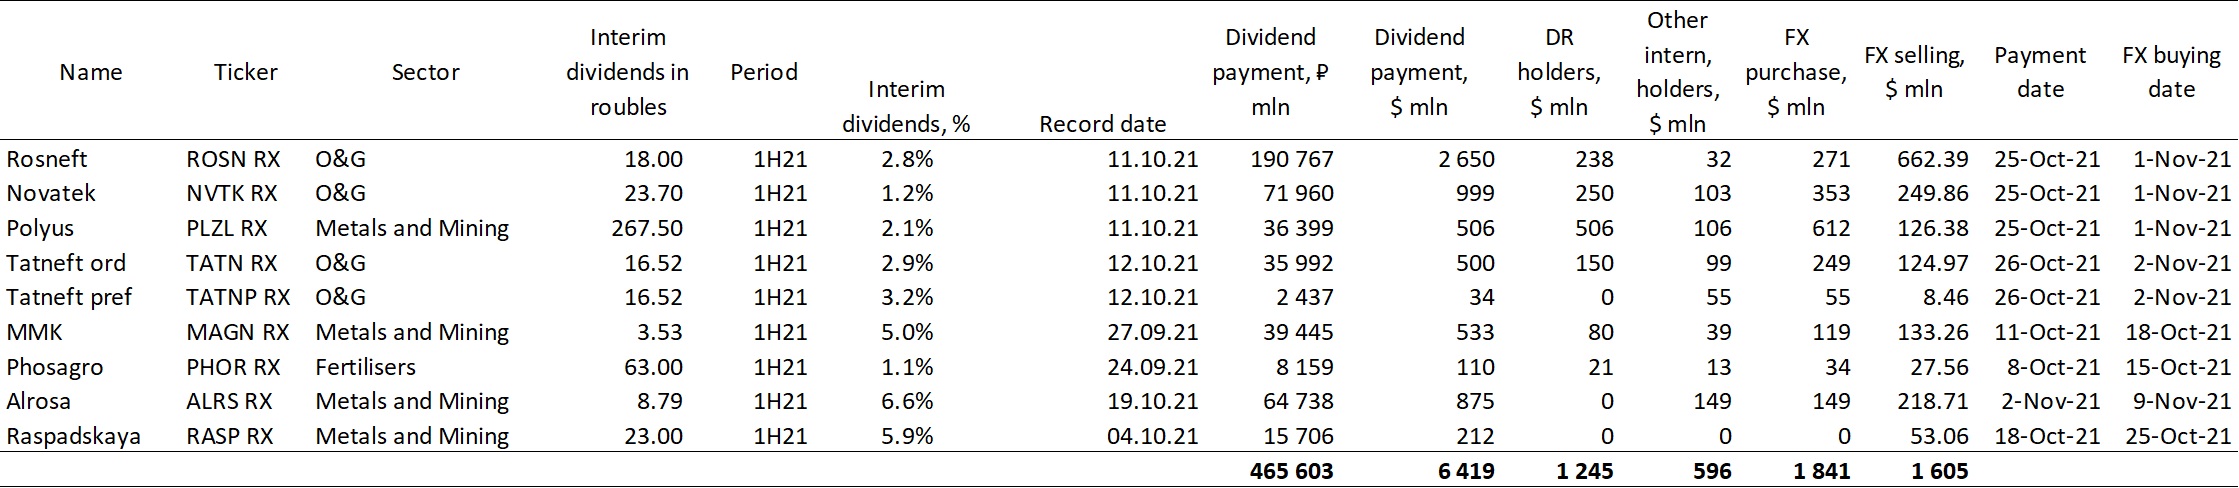
Source: ITI Capital, Company data, Bloomberg
Estimated FX-sales during interim dividend payments for 1H21, $ mln
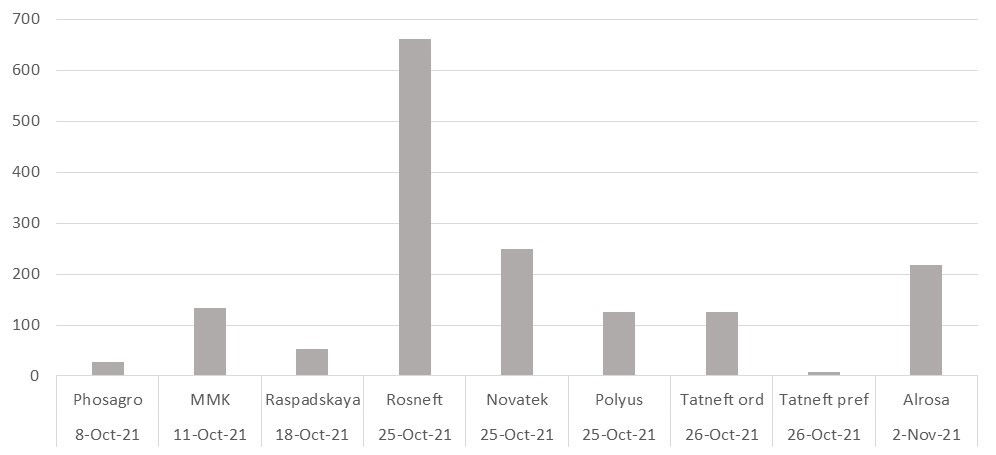
Source: ITI Capital, Company data, Bloomberg
Positive mid-term factors for the rouble
1) Oil and gas prices are likely to remain high for at least another six months as part of the commodity cycle
2) Further growth of Russia's oil production under OPEC+ deal and export revenue growth
3) Use of liquidity from the Sovereign Wealth Fund to finance infrastructure projects - about ₽1.6 trln ($22 bln through currency sales) of the ₽14 trln available at the end of August 2021
4) Monetary policy normalisation and resumption of non-resident funds inflows
The DXY daily moving correlation over the last six months, %
Source: ITI Capital, Bloomberg
DXY and UST 10 yield
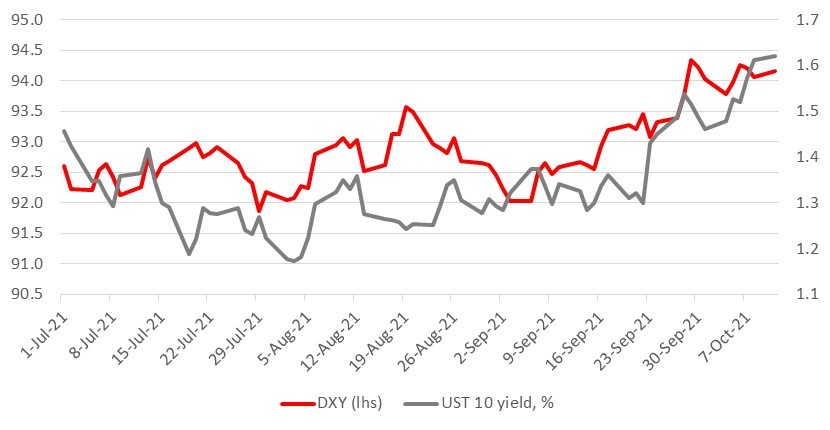
Source: ITI Capital, Bloomberg
