ITI Capital global commodities review: The revenge of the old economy — what to buy?
Burning Fuel Economy
- Global commodities rally continues and burning fuels demonstrate exponential growth rising on average by 120% ytd which includes mostly European natural gas (+276%), coal (+204%), US natural gas (+147%), Chinese thermal coal (+86%), US gasoline (+60%) and Brent oil (+54%). Burning fuels account for 83% of global primary energy consumption in 2020, according to BP statistics.
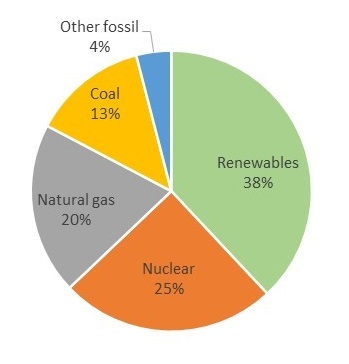
- Globally in terms of electricity generation, coal is the major source of electricity accounting for 35% followed by renewables 28% (large share or 58% of it is hydroelectric power), natural gas 23% and nuclear energy 10%. Oil as an electricity generation source accounts for only 3%. Oil major global use is transport which accounts for 66% (out of which 50% is road and 10% aviation) and industrial use is the remaining 28%.
- Much of the price increase is due to deep rooted bottlenecks, vaccine driven demand recovery, widespread supply shortfalls leading to under capacity in gas and oil storage (around 30-35% gas below storage capacity in Europe) and chronical under investments due to cut in long term capex program in gas and oil industry mostly.
- The consequence of this for producers and consumers has been skyrocketing inflation, PPI indices worldwide are at historical highs and headline CPI in Europe for September y/y have reached the highest in 13 yrs, while in the US it is approaching earlier 30-yrs highs. Global central banks started to shift to a more hawkish stance even in developed economies with traditional low rates, hence best hedge for that has been and will remain so the reflation trade via buying energy and metal commodities and corresponding stocks.
Electricity generation by fuel in % based on contribution measured in TW/h
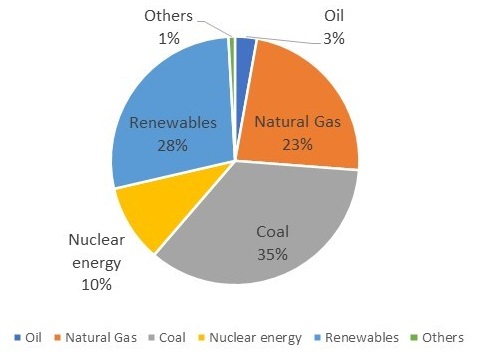
Source: BP statistical review, ITI Capital
Primary energy consumption by fuel*, 2020
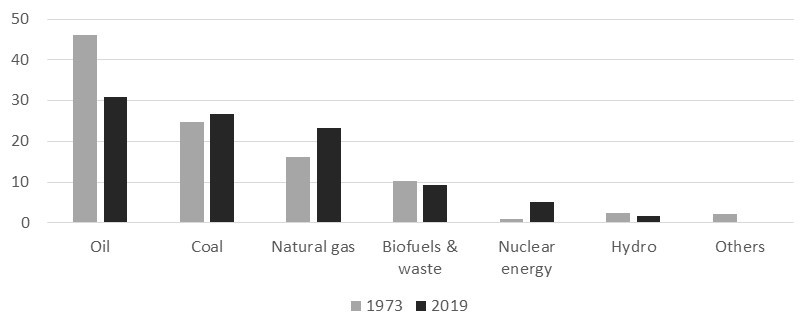
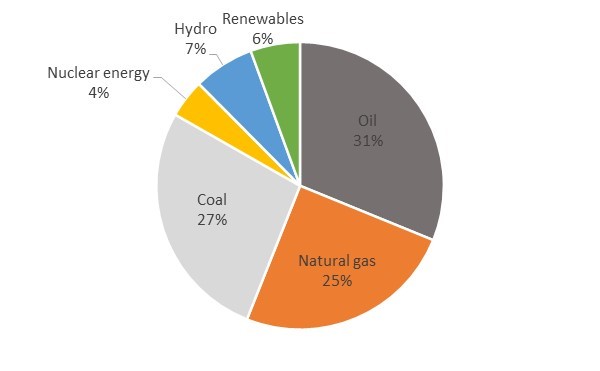
Source: BP, ITI Capital
* The amounts are rounded and given in million tonnes of oil equivalent per year (1 Mtoe = 11.63 TWh, 1 TWh = 109 kWh)
Global commodities performance, ytd, %
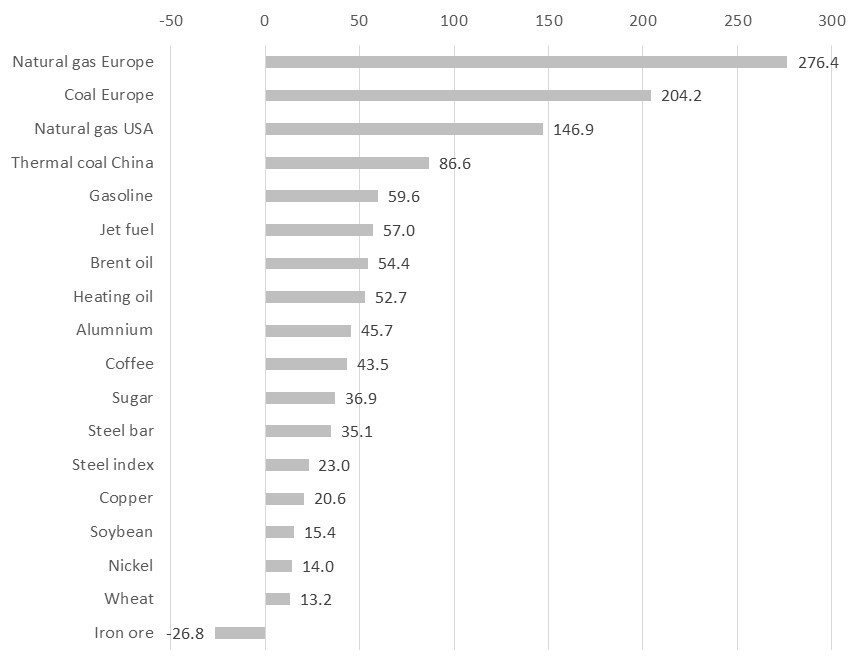
Source: Bloomberg, ITI Capital
Countries and regions with the highest reliance on energy imports such as the EU, China and US are driving up the prices. EU the third largest electricity consumer (2 780 000 GW/h) before China (7 562 000 GW/h) and USA (3 989 566 GW/h) is under most pressure due to traditional high reliance on alternative energy sources and this year wind power which account for 23% of renewables has stopped blowing. According to EU statistics of electricity consumption for 2020 green energy accounted for 63% and burning fuel was 37% in the region.
European source of electricity in 2020, TWh
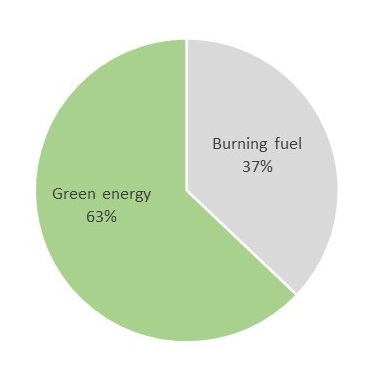
Source: Eurostat, ITI Capital
- In China electricity consumption is driven mostly by coal 62% and in the US it's mostly gas 40% but the US is mostly self-sufficient. Current energy crisis that is now affecting all industries from fertilizers to metals and mining and has led to regional electricity distributors bankruptcies and regional blackouts in China offers a glimpse of what is in store for other commodity markets, with widening deficits and depleting inventories leading to elevated price volatility as markets struggle to balance strong demand with sticky supply.
US and China sources of electricity in 2020, GWh
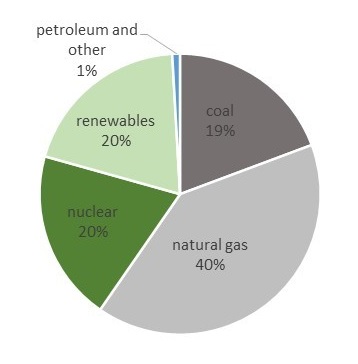
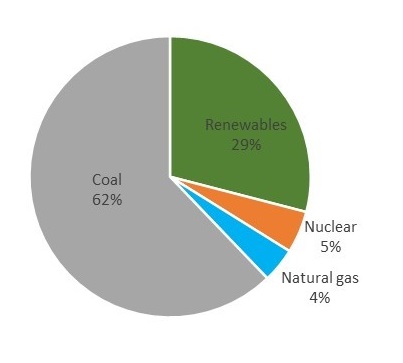
Source: EIA, ITI Capital
- As we approach winter heating season and supply remains tight both in terms of imports and what is available in storage we are moving towards late cycle demand growth and higher prices which could have a brief relief in mid-2022.
- However even then the structural deficit could remain the issue due to the collapse of the long term capex program since the subprime crisis in 2007 in favour of the short cycle capex program plus expansion in alternative/green energy and many other factors mentioned below.
- The lower the inventory cover, which is now approaching critical operational levels, the bigger the risk and the larger the scarcity premium in prices especially if weather conditions will worsen in the upcoming winter heating season.
What’s the reason for the rise in burning fuels?
Structural/Fundamental factors:
- Collapse of long term capex program 5-10yr and shift towards short term
- US under-investment in domestic transportation infrastructure and equipment due to a reliance on Chinese imports
- Growing demand for alternative energy, decarbonisation, trade wars and high costs from ESG emissions
- Inability for shale producers to sustain production growth (given their low reinvestment rate targets) and oil service and carbon cost inflation will all instead point to the need for sustainably higher long-dated oil prices.
- Pick up in OPEC+ production would only delay rebound in US oil shale production and further extend under investment
- In addition, a large ramp-up in OPEC+ production would simply fast-forward the decline in global spare capacity to historically low levels, replacing a cyclical tight market with a structural one.
- Limited downside risk from China, most global economists not expecting a hard landing and with our demand growth forecast driven by DMs and other EMs instead
Tactical factors:
- Demand for physical goods has fully recovered and is now above pre-pandemic levels but inventors and supply are still way below it. Countries and companies cannot increase capacity due to remaining restrictions from covid-19 pandemic
- Exceptional weather conditions as wind capacity utilisation in continental Europe dropping sharply this summer and hydro generation in Southern Europe following climate change-induced droughts exceptionally low, requiring thermal power generation to step up.
- The supply of truck chassis is down 35% from the historical average due to poor historical returns and tariffs on Chinese manufacturers
- Falling imports of LNG from US multi year lows as well as falling imports from Russian pipeline
- Sticky recovery in US oil production from Hurricane Ida
How long will it last?
- Given that the current abnormal situation is mostly driven by demand recovery and supply bottlenecks due to remaining mobility and transport restrictions, normalization will come after all restrictions will be lifted. Number of vaccines administered is around $6bln but only 40% of population worldwide have been fully vaccinated and 60% with at least one dose
- At the current pace of 29 mln doses per day it will take six months to cover 75% of the population bringing life to normal and lifting all of the restrictions. However manufacturing capacity, however, is steadily increasing, and new vaccines by additional manufacturers are coming to market.
What will happen next?
- Demand destruction is the only option to rebalance markets which requires sharply higher prices to curtail demand in line with supply.
- European energy pricing dynamics offer a glimpse of what is in store for other commodity markets, with widening deficits and depleting inventories leading to elevated price volatility as markets struggle to balance strong demand with sticky supply.
- Power outages in China have been slowing aluminium production leading to higher imports and higher prices.
- We expect industrial substitute driving further oil demand with near term target of $90/bbl by year end, increase in European gas prices reaching €115/MWh (partly driven by higher costs of emissions above their prior auctions prices), growing demand for gasoline, jet fuel from ease in lockdowns and thermal coal in medium term as a switch from gas. Majority of the rise in oil, gas and coal and electricity is from self-reinforcing upward spiral in carbon/gas prices and will continue in the medium term.
What to BUY?
- We recommend exposure primarily to the global O&G sector as part of reflation trade as it’s the only sector that is trading with a huge gap to the base asset. Current underperformance gap is around 50% based on corresponding oil price and has now increased to 20% for metals and mining companies.
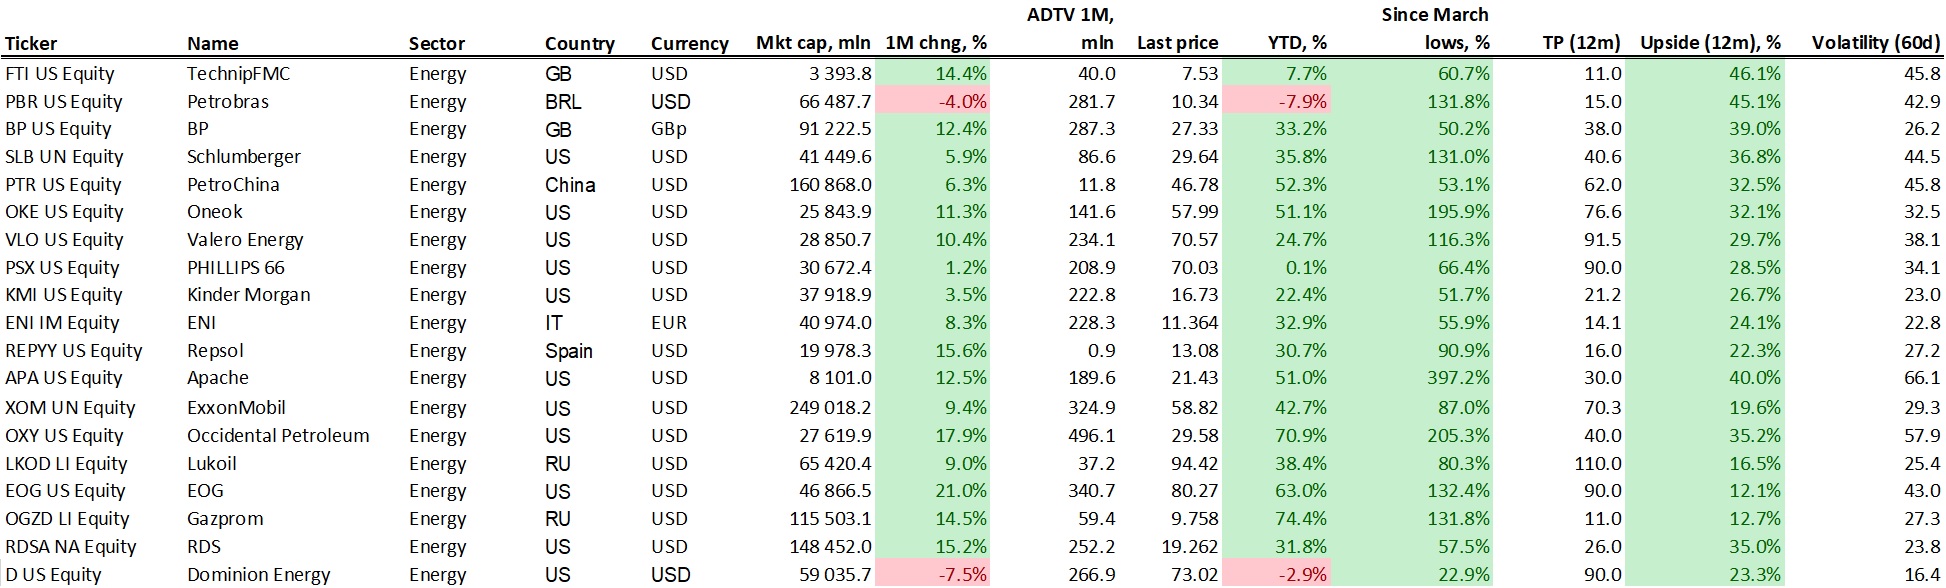
Source: Bloomberg, ITI Capital
Relative performance of global O&G vs base asset
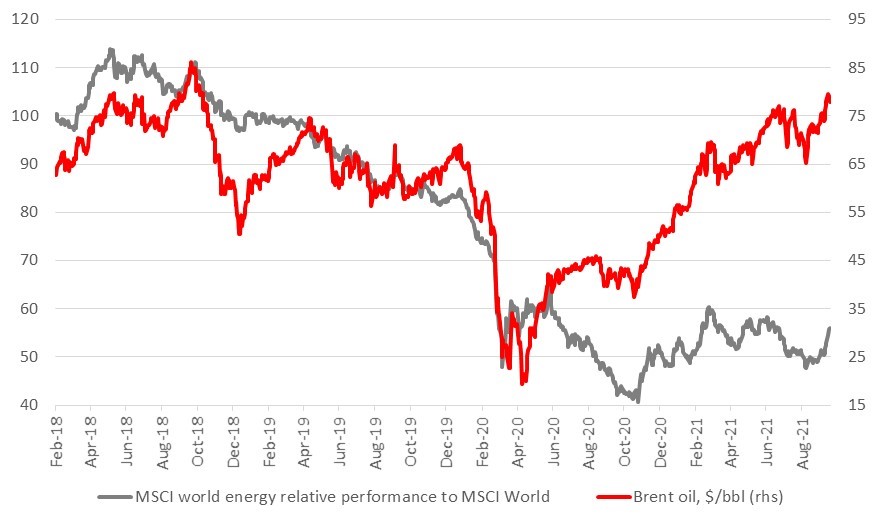
Source: Bloomberg, ITI Capital
Relative performance of global metals and mining companies vs base asset
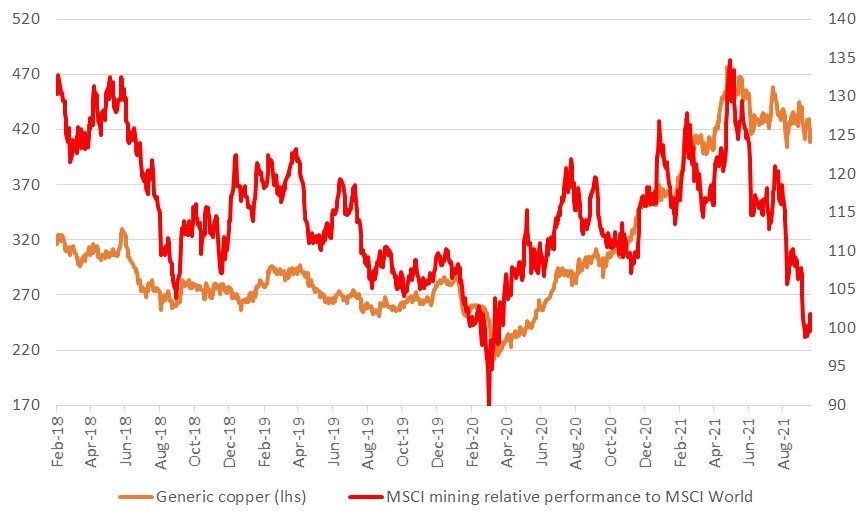
Source: Bloomberg, ITI Capital
