ITI Capital: Investment opportunities between First and Second wave of COVID-19 pandemic
Рынок Акций
Рынок Облигаций и Валюта
Main conclusion
- We think that global volatility will remain high within the next few weeks, overall global reopening will continue, but at a moderate pace with occasionally temporary lockups in some countries and the U.S. states like the recent announcement by the governor of Texas that is still in mid-cycle of new infections. We identify four countries that face the highest risks of new infections numbers rise from the first wave of the pandemic which are the U.S., India, Brazil, Chile, and Russia. However some of the U.S. will continue reopening their economies moving to phase 2-3, New York is moving to phase 3 on July 6.
- We think that the peak of market run will last for two months, from the third week of July till the end of September. Before that correction and consolidation are likely to dominate implying good demand for gold, IG US corporate bonds as well as OW in U.S. dollar positioning against EUR and EM export-oriented countries.
- We believe that the official trough of first wave of pandemic is likely to come at the end of August, hence a drop in new infections across troubled regions mentioned above will occur at least few weeks from now, so by the end of August/mid-September we will see flattening of a cumulative cases curve.
- In the end, according to virologists it does not appear to be any pattern or rhythm to the historical epidemics, as much depends on the effects on the human body and their impact on society.
- Therefore the next two weeks will see volatile and mostly bearish trade sessions. As soon as investors gain confidence and see evidence of new infections decline rate in the U.S. and other countries, abundant cash and excess global liquidity from central banks will push S&P 500 to record highs. For that to happen countries will need to bring back temporary quarantine and policy measures to reduce further risks of virus spreading, weather conditions will also improve the situation.
- According to our base scenario, we could see S&P 500 heading to 3500 pt by end of September pulled by oversold companies from production and service sectors of the U.S. economy and elsewhere except IT which is overstretched, overcrowded, and overheated. Some 60% of the U.S. companies weighted by the market cap are trading below their level as of the end of February (pre COVID-19 level). These are mostly transport, manufacturing, finance, and entertainment.
- If a vaccine is not available anytime soon, the second wave of the pandemic is likely to come in November/December. Hence markets will be very shaky ahead of the crucial election period in the U.S.
- If Joe Biden wins, there market will see strong sell-off, as his first policy actions will be aimed at restoring corporate taxes to levels seen before Donald Trump cuts and significantly reducing budget spending which could top unprecedented 15-20% of GDP this year, up from 4.7% in 2019.
Key indicators forecast
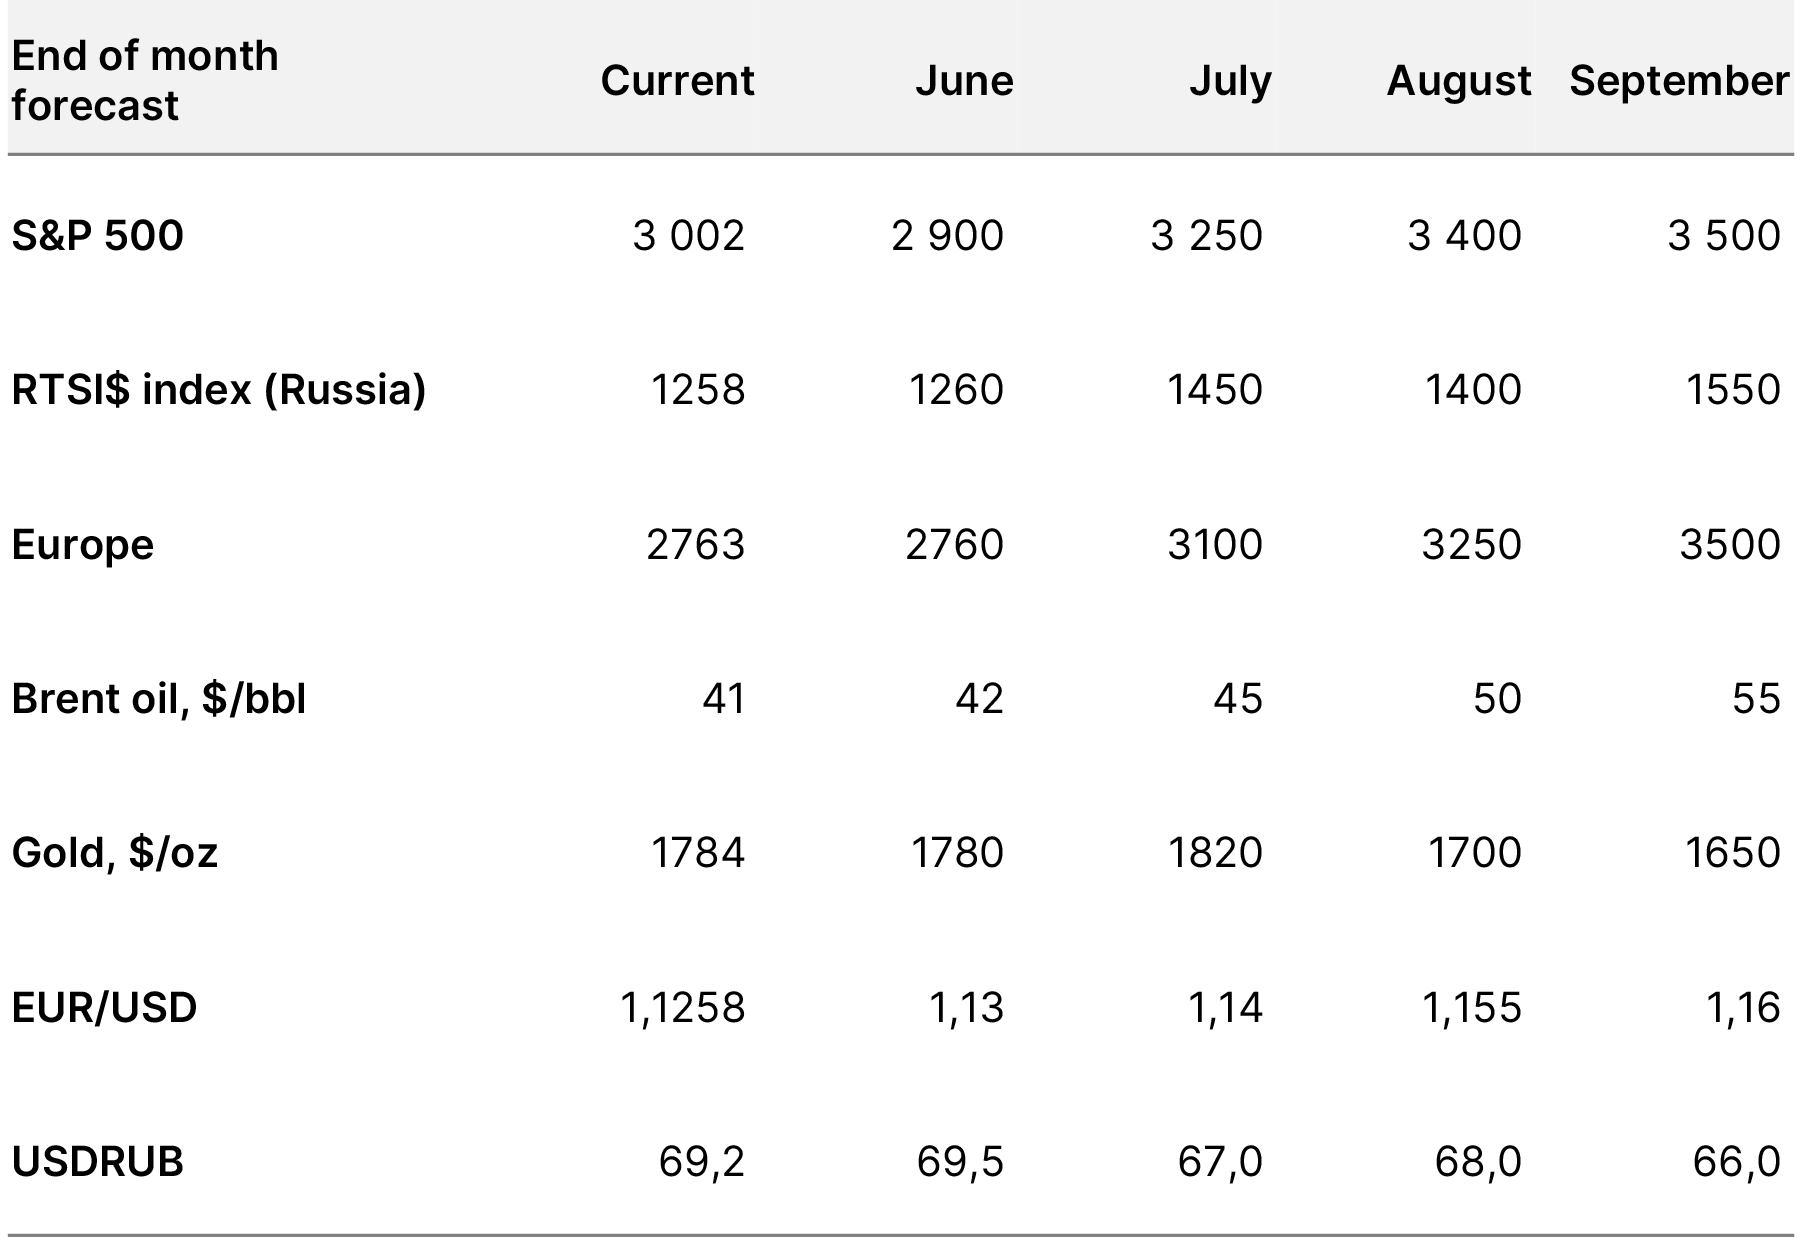
Source: ITI Capital, Bloomberg
A brief history of market recovery
- After S&P 500 reached its local high of 3 233 pt on June 8, just 153 pt, or 4.5%, below an all-time high of February 19, 2020 due to earlier reopening and a V-shaped economic recovery in May (US NFP data in particular was the key trigger in the U.S. and in other countries) after seeing an all-time trough in April, the index started to decline. The very first trigger was sanctions against the Chinese officials, then poor Chinese production data for May, the market was looking for a correction which occurred on June 11 and the reason for it was the FED’s economic forecast downgrade and new spike of COVID-19 in California.
- S&P 500 lost 230 pt or 7% which is near $4 trln of market cap over just three working days. Then bulls regained some of the earlier losses on the back of stronger retail sales and growing optimism that despite a temporary spike in the COVID-19 after an earlier reopening, a V-shaped recovery is on track supported by the FED monetary stimulus and potential new round of fiscal stimulus for $1 trln plus additional infrastructure project for $1 trln. Against this backdrop, the S&P 500 bounced back to 3 123 pt, offsetting 65% of losses, but dipped again on June 25, as incidence rate in California and other thirty states increased for the second consecutive week since June 11.
V-shaped recovery across major assets (normalized performance)
-576.png)
Source: ITI Capital, Bloomberg
The primary reason for volatility surge
- The primary reason for the market downfall is not the U.S./China trade related disputes or any other geopolitical market sensitive tensions which have become an essential part of the global volatility environment since 2018 and not even a gloomy 2020 global economic outlook which was recently downgraded by the IMF from -3% to -4,5%, since the market and investors including us are FOCUSED only on COVID-19 statistics. The U.S. is the world’s largest economy, its reserves currency accounts for 65% of all global transactions and, is now the epicentre of COVID-19 accounting for 26% of total infections worldwide.
- The number of new coronavirus cases has increased from 21 states to 33 states since the beginning of June, though mortality rate continues to fall.
- The market is worried that the number of new infections is rising amid global reopening. The U.S. public health officials are expressing concerns about rising case counts, positive percentage of tests, and hospitalizations in the Southern and Western states.
- Therefore New York, New Jersey and Connecticut issued a travel advisory that requires people arriving from states with high coronavirus rates to quarantine for 14 days.
- The recent case increases have already started to delay some plans to reopen economies. In Louisiana, Gov. John Bel Edwards postponed moving the state into Phase 3 of its reopening for an additional 28 days amid a surge in cases and hospitalizations there.
- Walt Disney delays opening in the U.S. till mid of July and Apple continues closure of some of the stores in states where infections rate remains elevated.
New cases of infections in the U.S. from the first wave
-662.png)
Source: Covid tracking, ITI Capital
This is not a second wave; we are still in the mid-cycle of the first
- Death rates, another important indicator of the pandemic’s gravity, continues to drop nationally, but lags several weeks behind infections rate. Public health officials warned that a rise in infections among young people, who often experience milder disease, could in turn lead to the virus being transmitted to more-vulnerable populations.
- We are still in the first wave and as in the sea, waves are usually preceded by a trough, because for the second wave to come we need to reach a trough after the first wave. For the first wave to go away we need to see a sharp decline in the number of new cases which will lead to flattening of cumulative infections and death cases curves.
- At the moment, new infections number is rising, after a temporary drop in new cases in the U.S. from 36,000 new cases (peak levels of April 22) to 16,600 (end of May). It has been rising exponentially since June 7, and in 18 days rose by 23,000 to a new high of 39,000 people, therefore the daily growth rate was 1,300, hence the number of cumulative cases in the U.S. has not been falling, but rose to 2.3 mln over 120 days.
- The main conclusion is that the reopening came too early, as the number of cases in most countries has not reached a turning point except for Spain, the U.K., Italy, Chile, Peru, and other countries. The turning point is the flattening followed by a decline which will lead to a flattening of the cumulative number of cases, and only after we will see a second wave. Countries with the number of cumulative cases rising include the U.S., Brazil, Russia, and India.
- The good news is that according to worldmetres just under 70% of all countries (140 countries) reported no new cases in over the past few weeks, while the rest see new cases of infections. Hence global flattening of the cumulative cases curve is very likely if the number of new cases will continue to drop which depends on how situation will develop in the U.S. which accounts for 25% of total cases worldwide. Logarithmic scale of total coronavirus cases shows that we are about to see flattening of the curve.
- We think that the number of new cases will fall if some quarantine measures will be reinstalled in the U.S. and other countries, otherwise number of new cases will remain high but the growth rate will decline naturally even without quarantine measures which was the case in every pandemic including the most lethal like Malaria.
Cumulative number of reported cases and hospitalizations in the U.S.
-987.png)
Source: Covid tracking, ITI Capital
Do weather conditions influence the transmission of the coronavirus (SARS-CoV-2)?
- A study from CEBM (The Centre for Evidence-Based Medicine) correlated cases with mean temperature and explored the effect of temperature on transmission in 429, mainly Chinese, cities. They found that for every 1℃ increase in the minimum temperature led to a decrease in the cumulative number of cases by 0.86.
- Analysis of the SARS outbreak in Hong Kong, Guangzhou, Beijing, and Taiyuan found the optimum environmental temperature associated with the SARS cases was between 16 to 28 degrees Celsius.
- Results suggest that temperature does positively correlate with infection rates spread, whereas it negatively correlates with humidity. Temperature and humidity are likely to contribute a maximum of 18% of the variation in transmission.
- According to CEBM, both the 1918 and 2009 outbreaks are similar in that they started in the ‘spring wave’ and went on into the summer. These spring/summer delays in the initial numbers infected are thought to have little impact on the overall attack rate.
Relationship between temperature and the predicted number of cases
-906.png)
Source: CEBM
Seasonality does matter and helps
- Limitation of contacts during summer vacation of the 2009 outbreak led to the summer trough before the infection picked up again – the ‘wave’ – into the winter.
- According to CEBM, the last five outbreaks, since 1957-1958, occurred in the space of two years. Five outbreaks are described as having a second phase, 2009-2010 had two mild phases; 2002-2003 had several phases that occurred within one year; 1957-1958 had two phases that were equally severe; 1889-1892 and 1918-1920 had two phases with the latter being described as more severe.
- We estimate that the second phase will come by November/December if vaccine isn’t in place and this will lead to the second dip of global markets. However before that markets will rally when we will see a trough of the first phase which is unlikely before the end of August/mid-September and the second wave in November/December as best scenario.
Epidemic history since 19th century
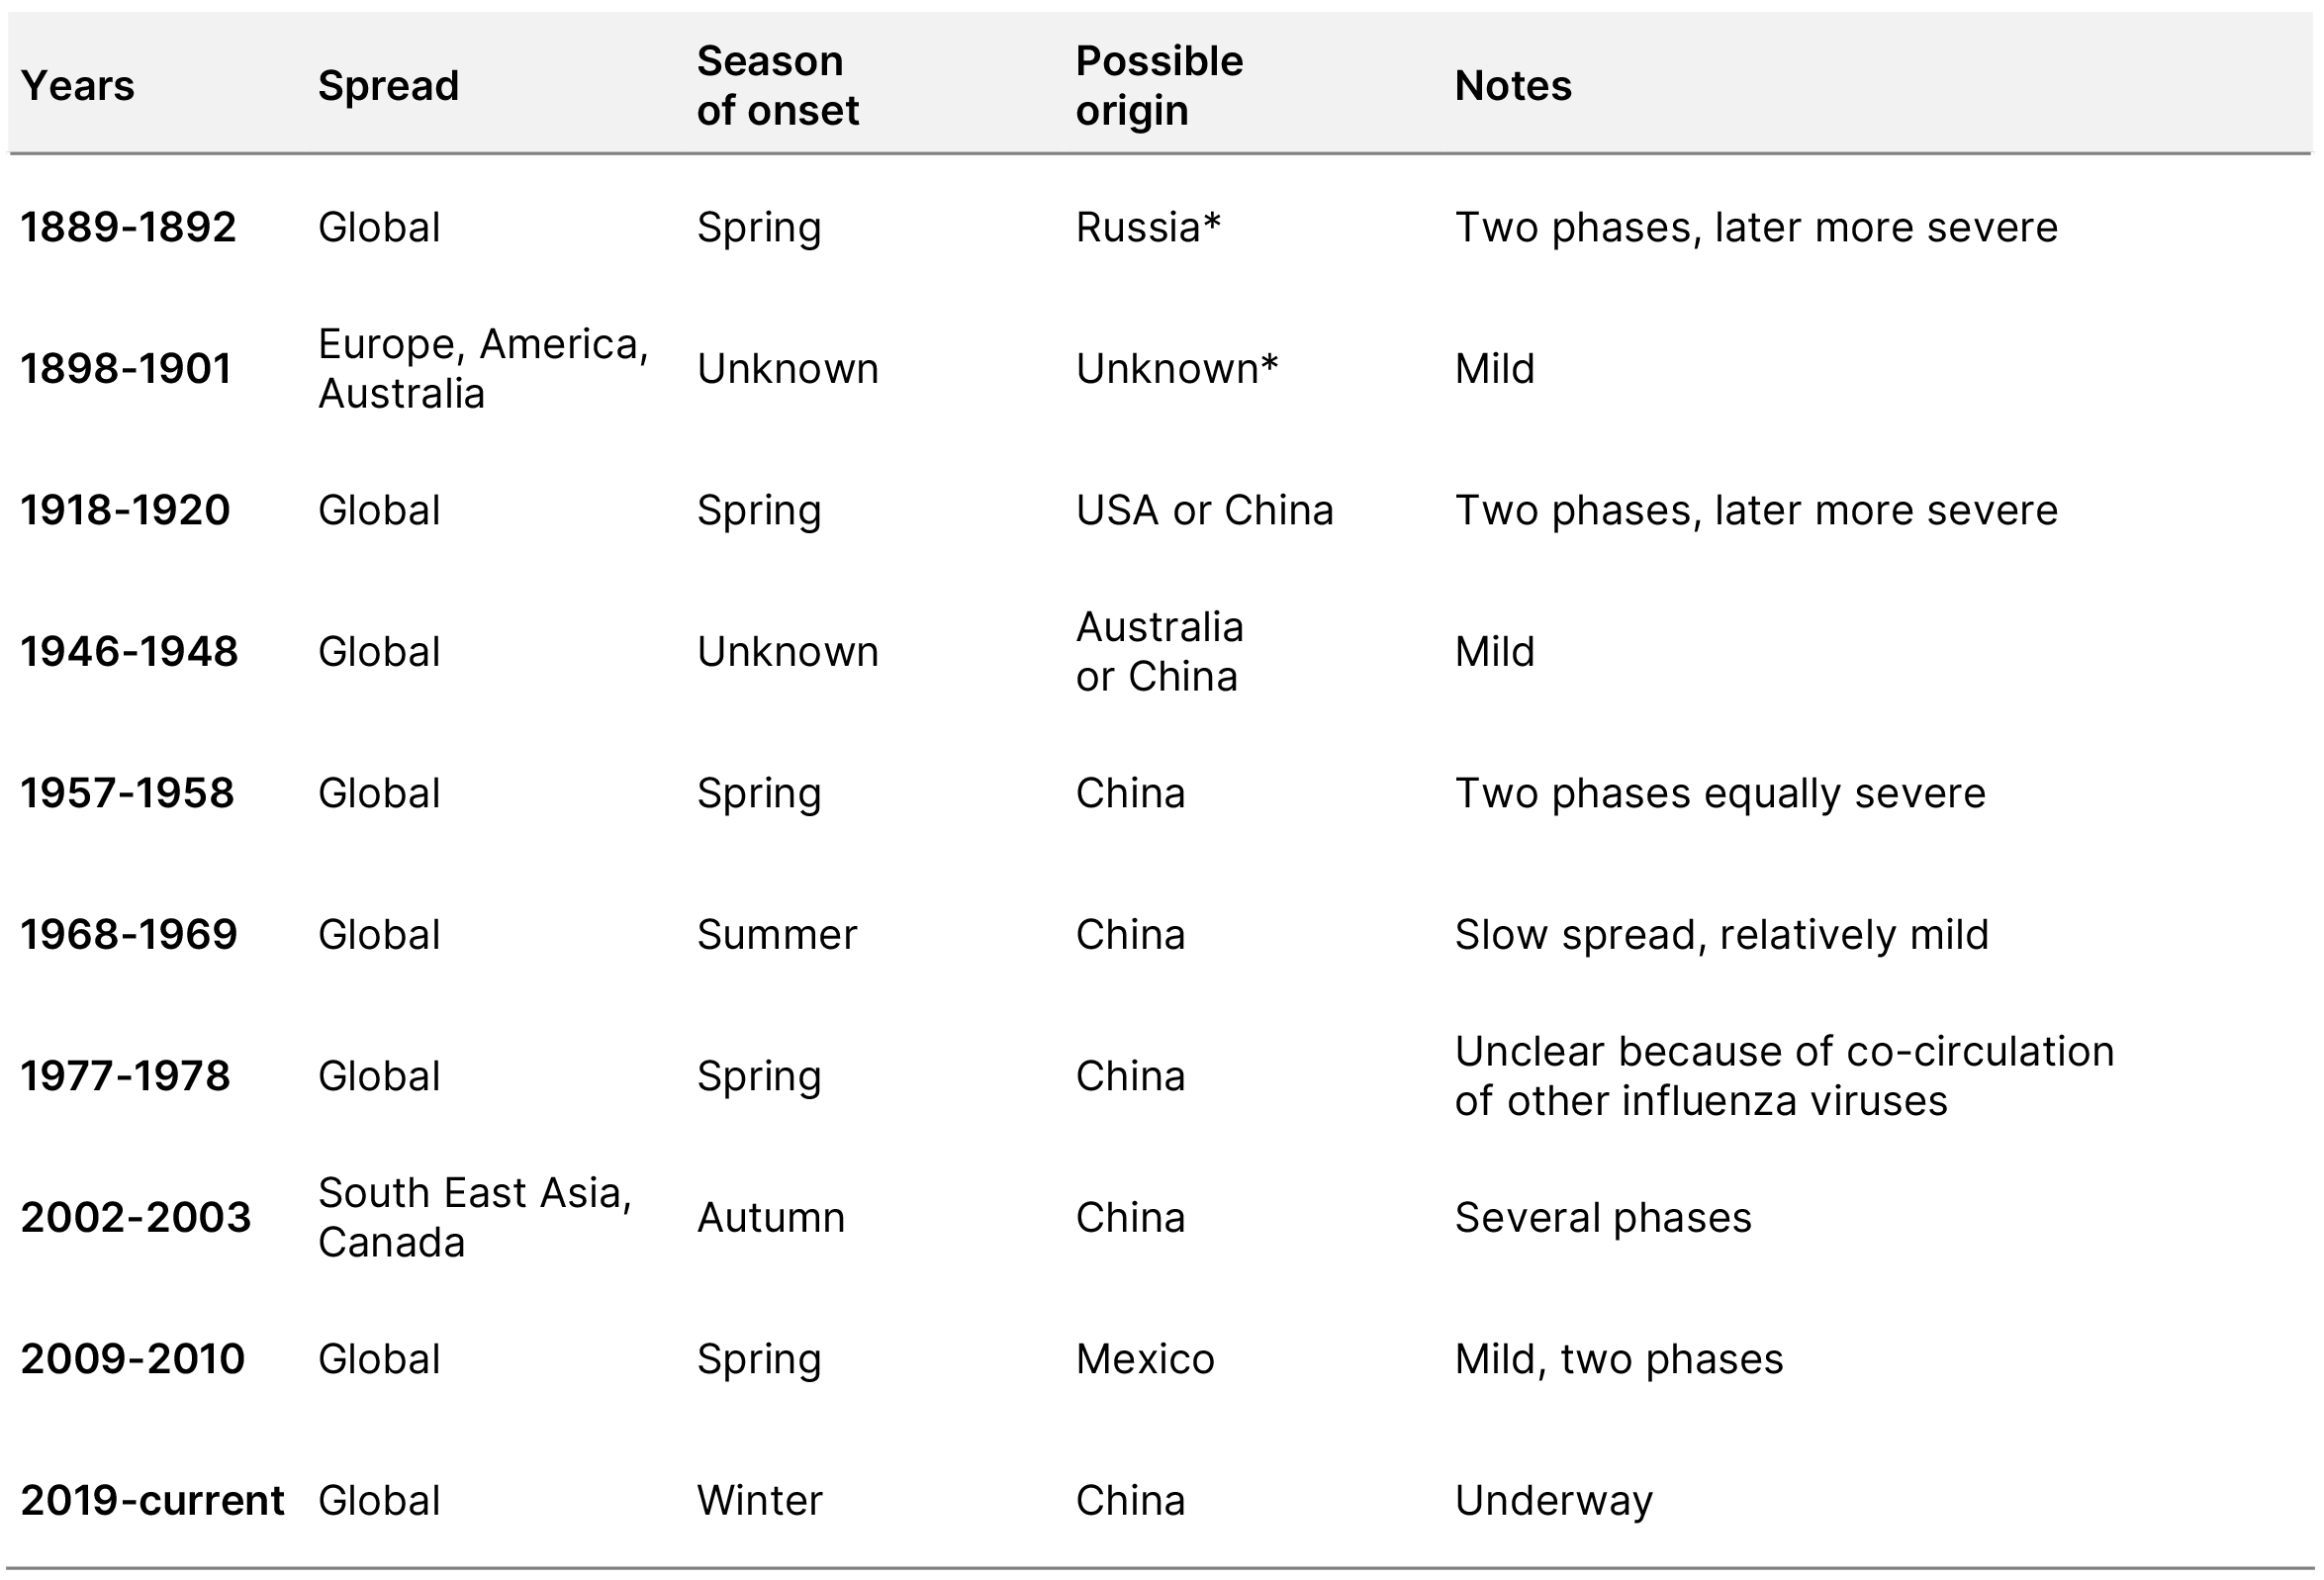
* Causality by influenza viruses was inferred by serological studies in survivors
Source: CEBM, ITI Capital
Printable PDF

Читайте обзоры,
аналитику рынков, инвест-идеи в нашем Telegram-канале